How to interpret your camera's histogram

Tim Parkin
Tim Parkin is a British landscape photographer, writer, and editor best known as the co-founder of On Landscape magazine, where he explores the art and practice of photographing the natural world. His work is thoughtful and carefully crafted, often focusing on subtle details and quiet moments in the landscape rather than dramatic vistas. Alongside his photography and writing, he co-founded the Natural Landscape Photography Awards, serves as a judge for other international competitions. Through all these projects, Parkin has become a respected and influential voice in contemporary landscape photography.
First of all - a caveat. This research was done on a Canon 5D Mk II (Read Tim Parkin's review of Canon 5D Mark III). If there is enough interest in the article, I am happy to continue by looking at Nikon cameras or other Canon cameras where possible. I have to admit that the delay in this article hasn’t just been because of a lack of time. I have been banging my head against a wall trying to find out just what is happening inside raw files and histograms. Fortunately I think I have got somewhere (although I might have to follow up with a more rigourous analysis with notes).
Whats up with the histogram?
I think most of us who use digital cameras (and that must include 95% of film users as well, with their little digital playthings) have looked at a histogram or the ‘blinkies’ to check whether they have over exposed their pictures and I’m sure a large fraction of those have heard of ‘expose to the right’. But how accurate can we actually get our exposure using these tools? We’ll take a look at just what this information is showing us and how best to use it. First of all, a quick note on why getting everything close to clipping is so important.
Exposing to the right.
Because digital data stores luminosity values linearly, the last ‘stop’ of light takes up half of the total amount of data that the camera can store. Actually forget that load of gobbledegook.
The more you can overexpose the scene without clipping, the better shadows you will get. Full stop. This means that you want to push the highlights as close to clipping as possible in order to avoid noisy shadows, even if the result looks over exposed on your LCD. Back to the histogram...
What data does the histogram and the preview ‘blinkies’ actually represent?
The first thing to be aware of is that both the histogram and the preview are not actually built using the raw data. They are created from a full size jpg that the camera embeds in each raw file. The problems with the histogram appear because the jpg is created using all of those settings that you ignore because you are shooting RAW (you are shooting RAW aren’t you?).
So, if you have increased the contrast and saturation in order to get a more pleasing LCD view, you’ve also changed the levels in the histogram and changed the point at which the blinkies trigger.
So what settings on your camera affect the histogram and blinkies?
- Contrast
- Saturation
- Sharpening
- Colour Temperature (and tint)
- Colour Space
Some of these affect your histogram/preview (for now I’ll just refer to the histogram) more than others. For instance, sharpening a smooth file will have very little affect. Sharpening a very fine pattern will create a large boost in highlights (all of the edge contrast will be enhanced and if the file is all edges...).
Contrast will affect the overall clipping levels the most, where an increase will push light values lighter and dark values darker (and vice versa). Saturation reduces the levels of the non-primary colours and it’s effects are hard to predict.
The biggest influence on the histogram is surprising though. The colour balance you set will cause the most significant problems and to understand why, you need to know a little about how raw files work.
What’s in a raw file
Some of you may know that most digital sensors have arrays of colours in them called ‘bayer arrays’. Each pixel only collects light of a particular colour and it takes a group of four pixels to record proper colour information.
These four pixels are made up of two green, one red and one blue value. Because the green pixels dominate in both amount and colour content, when you apply a colour temperature to your picture, the conversion multiplies the red and blue channels in order to ‘balance’ up the picture. Here are some sample values for different colour temperatures.
- D65 (red 2.3x blue 1.25x)
- Tungsten (red 1.4x blue 2.4x)
- Shade (red 2.5x blue 1.2x)
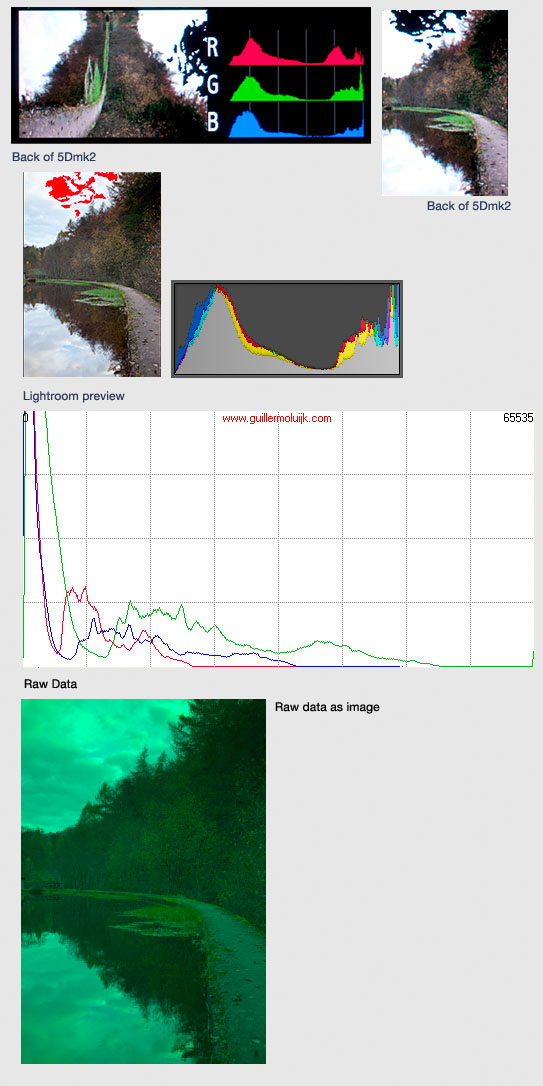
Because the JPG, preview picture and histogram all use these multipliers, you can quickly see that even if only the red channel looks like it is clipping in your picture, it is almost certainly not doing so (especially if you are working in the shade).
If the histogram on your camera is split into 5 sections horizontally, this means that if a red channel looks like it is just clipping, it is probably a whole section less than is shown (in the shade). For the blue channel, it is probably half a section less.
This pretty much means that the only channel whose data you can trust is the green channel.
Here's a visual example so you can see what is going on..
As an aside, what it does mean is that generally when you are taking a sunset, the red channel isn’t clipping anywhere near as much as you think it is.. The same goes to a lesser extent if you are working in deep shade where everything becomes blue.
So what can I do about it?
Well - there are a few tricks you can do, but you may not like them. There is a technique called ‘UNIWB’ (universal white balance) with which you can trick your camera into using unity multipliers for your jpg (i.e. force it to show a histogram for the raw data!). The problem with this is that in doing so, the pictures that end up getting displayed on your LCD come out looking green (as per the final image in the example above).
The way you do this ‘forcing’ is to drop a pink raw file onto your memory card and use this to set a custom white balance. You can follow the links at the bottom of this article if you want to do this (there are more complicated ways to do it better but you’ll get 90% of the benefits by just using one of the sample raw files you can download).
Alternatively, you can just ‘know’ what is happening to the histogram and use your common sense to cope with the headroom.
What about those Damned 'Blinkies'
Well it turns out that the blinkies use a combination of red green and blue channels and don't adequately show individual channels clipping very well at all. In fact, even with the UNIWB stuff, the blinkies on their own are flawed. The only real way to be sure is to use the UNIWB and keep an eye on the individual colour histograms..
Can I get the best of both worlds, a good histogram and a nice LCD display?
Well yes you can! Sort of..
I’ve started to play with using a custom setting (C1) which uses the UNIWB pink custom white balance and then having C2 as my ‘normal’ LCD display. C1 should allow me to check the proper histogram for my conditions - get an idea for the relationships between the different channels and clipping and then switch to C2 for taking and checking the shot. Not perfect but it should be a useful ‘learning’ aid.
In a perfect world what would happen
Well - in a perfect world the camera manufacturers would do a few things that would help the photographer..
- Show real, raw data histograms and blinkies.
- Allow you to ‘expose to the right’ but still show a well exposed LCD preview.
In order to do both of these it would be really nice to have a read out which tells you what percentage of pixels in the picture are clipping (possibly for each channel) and maybe also let you specify what percentage of pixels you want to allow to clip as an exposure system. A sort of ‘clipping priority’ to complement ‘aperture priority’ and ‘shutter priority’.
What about the other variables, saturation, contrast, colour space?
Well after a fair bit of testing, I can highly recommend setting your contrast as low as possible, your saturation at 0, your sharpening at minimum and using AdobeRGB as your colour space. If you can combine these with the UNIWB, you will get an almost perfect representation of what is happening in the RAW file..
Can I find out more about this?
You certainly can - the origins of the UNIWB are in the Nikon camp and long threads on Nikonians talk about it (you can actually set the RGB multipliers on Nikon cameras). Also, a very clever fellow named Guillermo Luijk worked out the 'custom white balance' stuff for the Canon.
Hopefully my contribution has been to make things a little more accessible? Who knows - if this has been pitched a little too geeky or too basic, please let me know. I'd be happy to expand or simplify in a future section.
References
Guillermo Lujik - Created 'Histogrammer' software and documented a lot around the process of creating UNIWB for generic cameras
Malcolm Hoar - Documented UNIWB for Nikon cameras (much easier to setup for it)


